The Plot Thickens

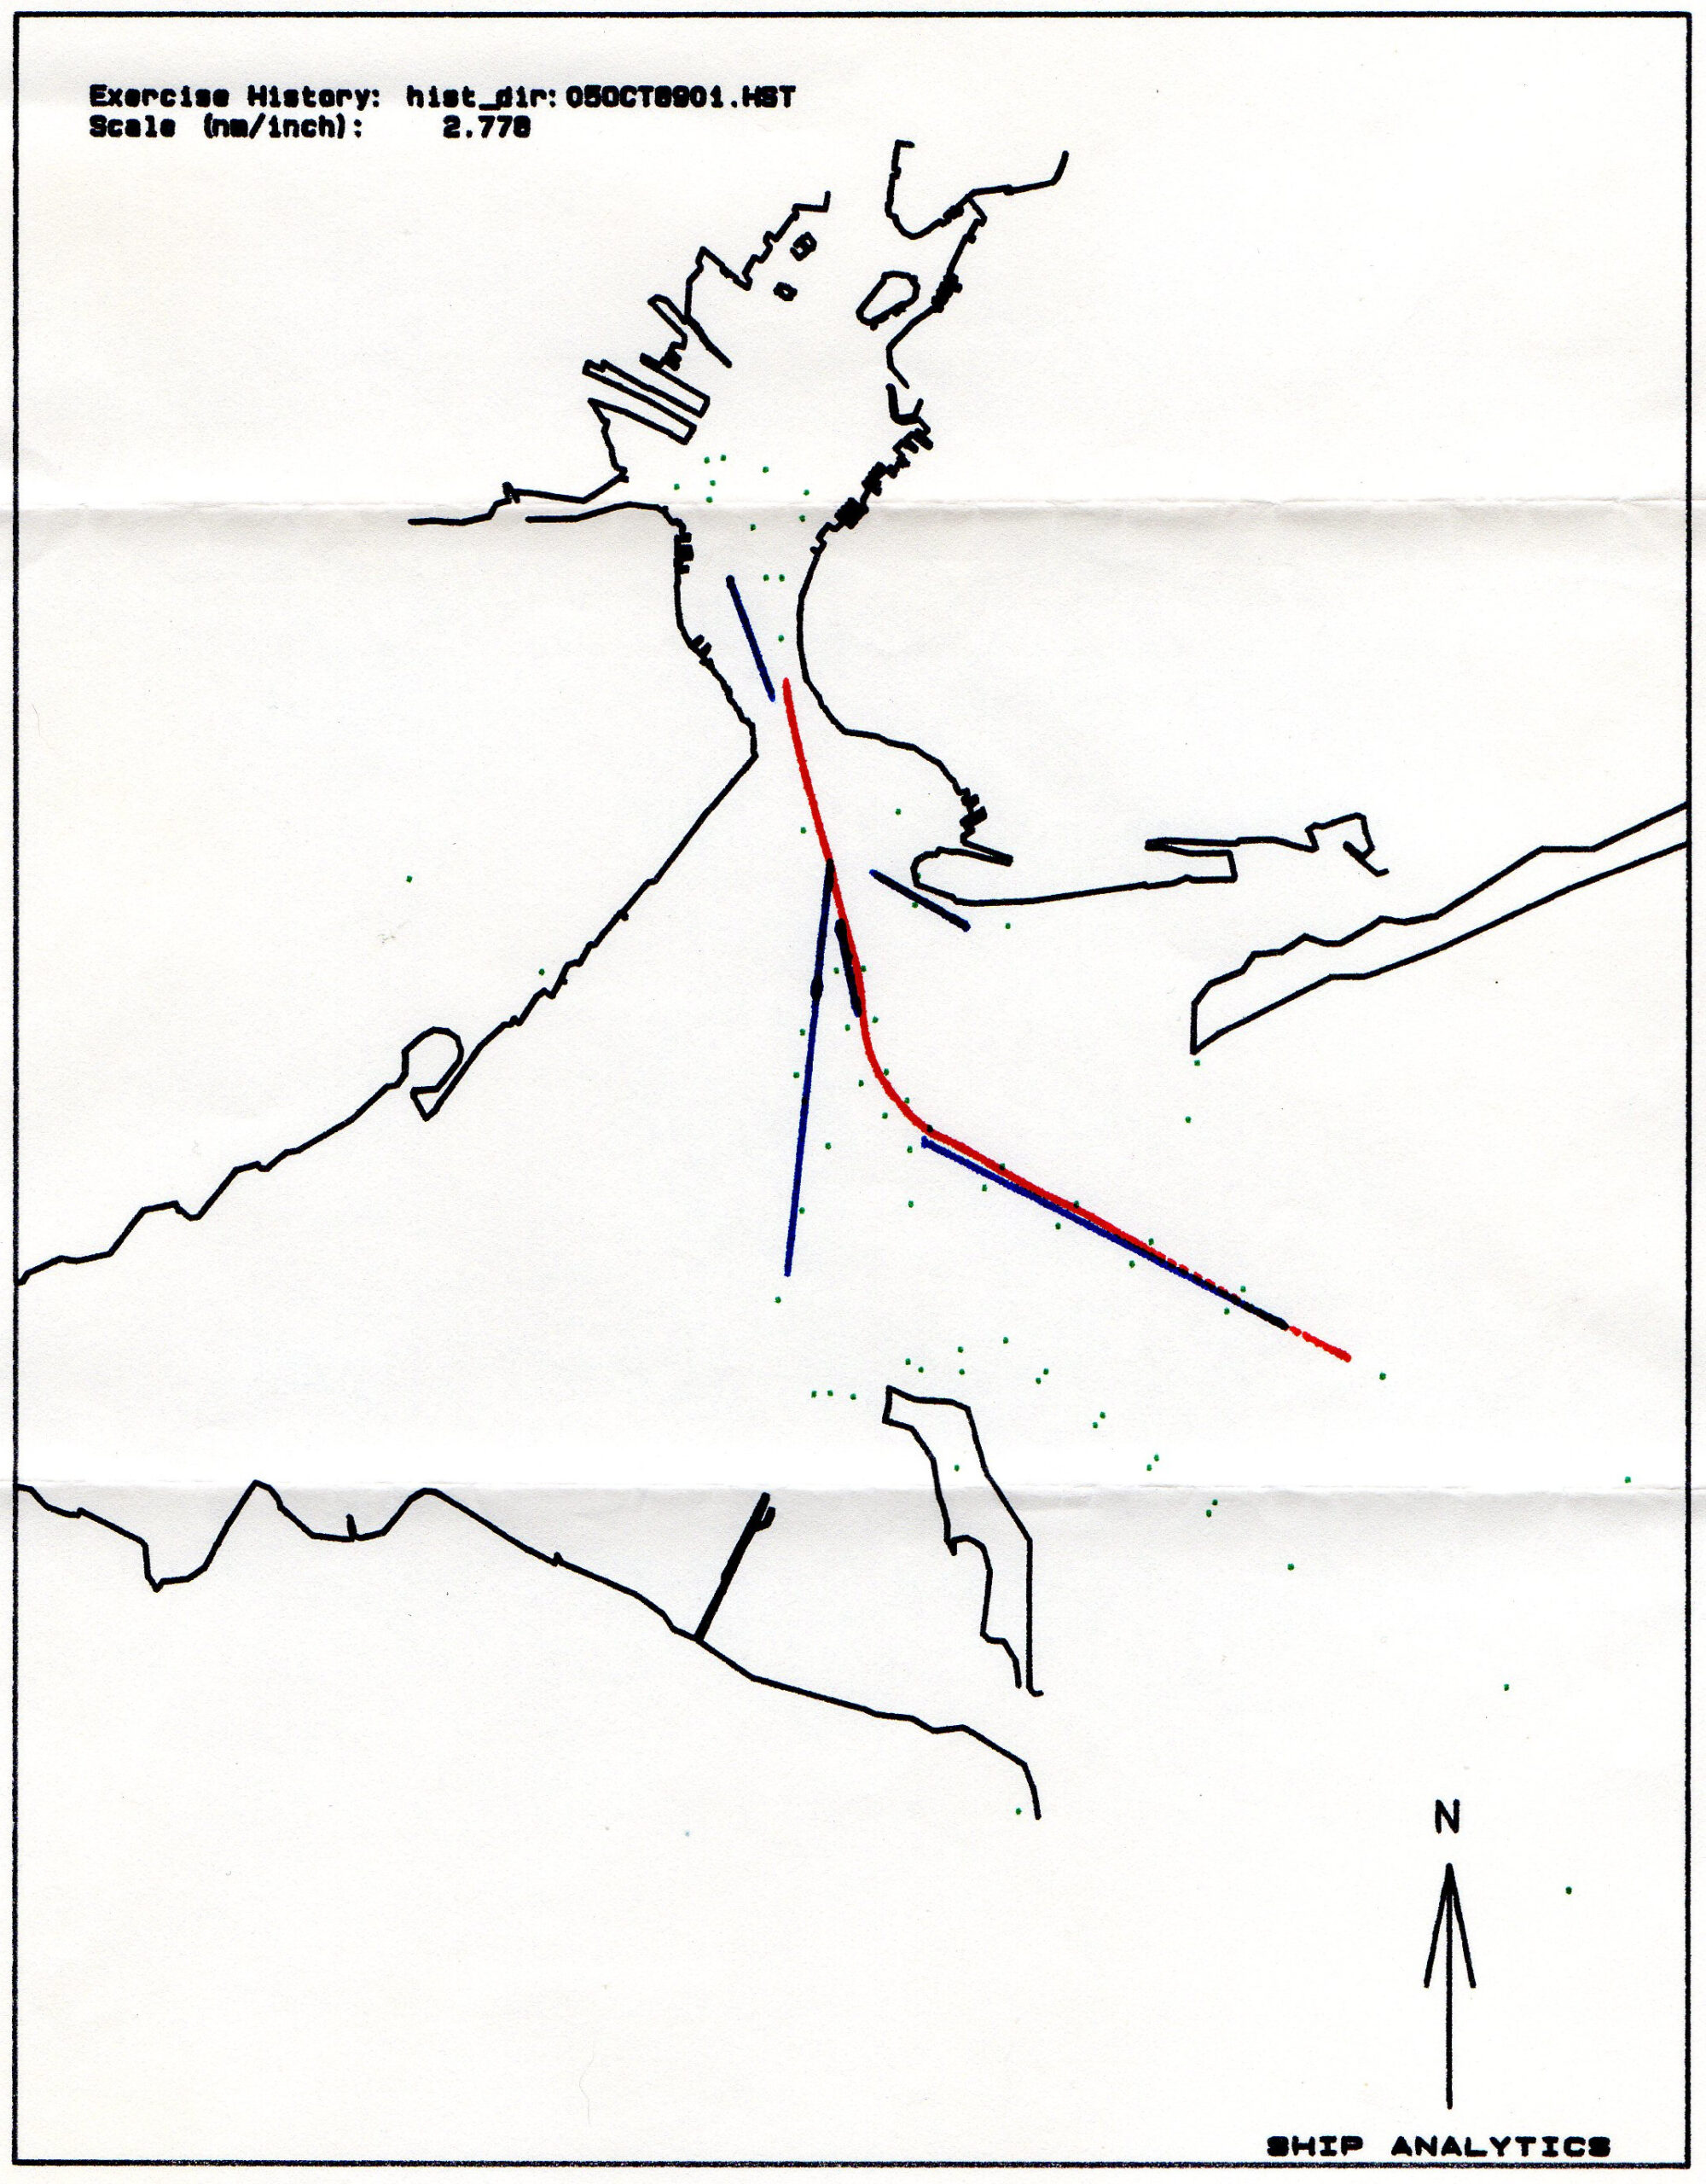
In a previous post, I mentioned that I rewrote the software that generated this plot:

Geoplot, Ship Analytics, New York City

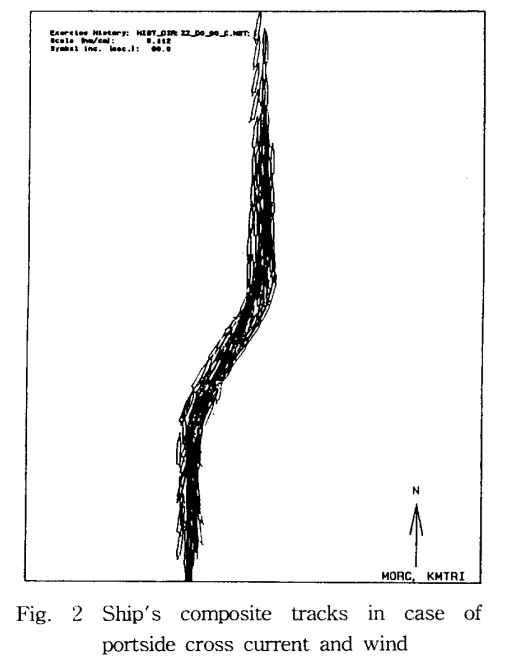
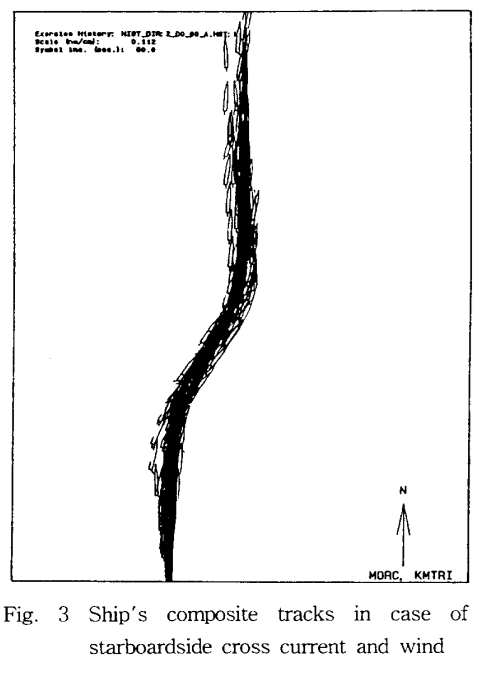
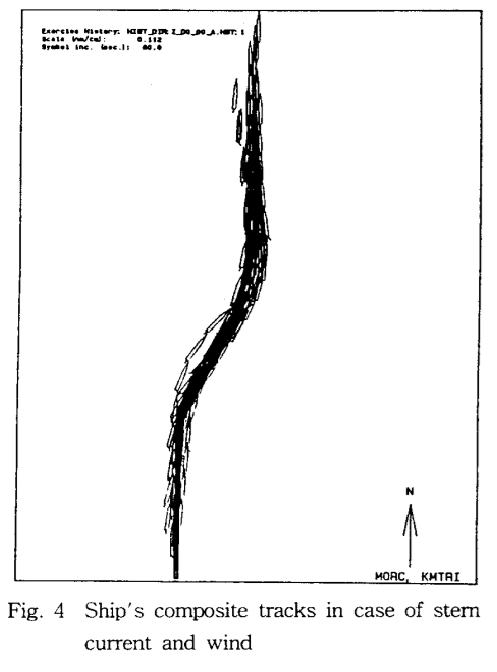
I found some examples of plots produced with this new version of the plotting software (via A Study on the Correlation between Shiphandler’s Subjective Evaluation and Maneuvering Risk in Curved Narrow channel):

Fig. 2 Ship's composite tracks in case of portside cross current and wind Fig. 3 Ship's composite tracks in case of starboardside cross current and wind Fig. 4 Ship's composite tracks in case of stern current and wind

The ship track outlines are to scale and if you look closely, you can see the rudder angle on the chip tracks. I remember changing “Ship Analytics” to “MORC, KMTRI” at the request of KMTRI while I was providing technical support for a port development project in Busan, South Korea.

The tracks are monochrome because I got the images from a .pdf file.

Leave a Reply

Your email address will not be published. Required fields are marked *

This site uses Akismet to reduce spam. Learn how your comment data is processed.

All trademarks and copyrights on this page are owned by their respective owners. Quotes from linked articles are probably the property of the publications linked or the property of the person(s) quoted. The rest © 2001- 2025 by James A. Chappell